"It is not the strongest of the species that survives, nor the most intelligent, but the one most adaptable to change."
— Often attributed to Charles Darwin (paraphrased from Leon C. Megginson)

Adaptive Persistence
Darwin’s Theory of Evolution, Explored Through Generations
Introduction
In 1859, Charles Darwin introduced the theory of evolution by natural selection — the idea that organisms better suited to their environment are more likely to survive and pass on their traits. Over time, this shapes the genetic makeup of a population.
Adaptive Persistence is a simulation that visualizes this concept in action. Built with Python and Pygame, it models a small environment where digital organisms must eat, drink, reproduce, and adapt — or die.
Each character has:
Hunger and hydration levels that deplete over time
Heritable traits like speed and reproductive thresholds
The ability to mate, produce offspring, and pass on traits with slight mutations
Over many generations, you can observe how small variations affect which traits dominate the population — and which ones disappear.
This simulation isn’t about scripting behavior. It’s about setting up simple rules and watching natural selection do the rest.
The Simulation Engine
The simulation is built using Python and Pygame, and is designed as a self-contained environment where characters interact with limited resources and simple rules.
Each character is an independent sprite with the following core behaviours:
Basic Needs
Hunger and hydration values start at 100 and decrease over time.
If either reaches 0, the character dies.
Movement
Characters move using vector-based smooth motion.
They roam randomly when idle, seek water when thirsty, and trees when hungry.
Reproduction
Characters reproduce when:
They are alive
Hunger and hydration are above mating thresholds (which vary per character)
A suitable mate is nearby (opposite gender, also ready)
A new baby character is spawned, inheriting:
Speed (averaged and slightly mutated)
Mating thresholds (also mutated)
Last name and an accessory
Genetics & Inheritance
Traits passed on:
Speed
Hydration/Hunger thresholds for mating
Random mutations are applied to ensure variation.
Over time, faster or more tolerant characters tend to reproduce more.
Accessories & Naming
Every character has a unique accessory (e.g. hat, glasses) and a randomly assigned first and last name.
Names and accessories persist through generations for visual lineage.
Obstacles
Characters avoid or phase through obstacles like trees.
If stuck too long, they temporarily enter a “phase” state to escape.
Visual Features and Feedback
The simulation isn't just about running algorithms — it's designed to make evolutionary dynamics visible and intuitive. Every visual element adds to the understanding of what's happening beneath the surface.
Character Design
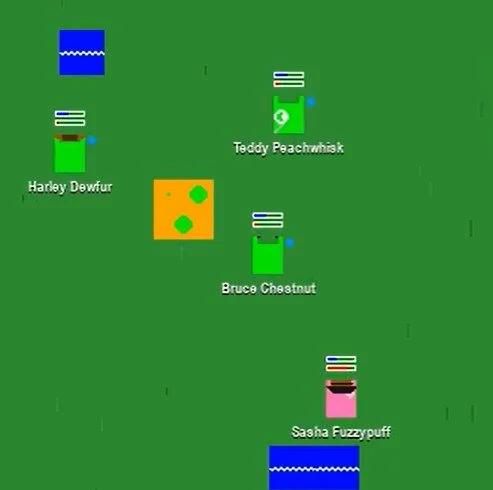
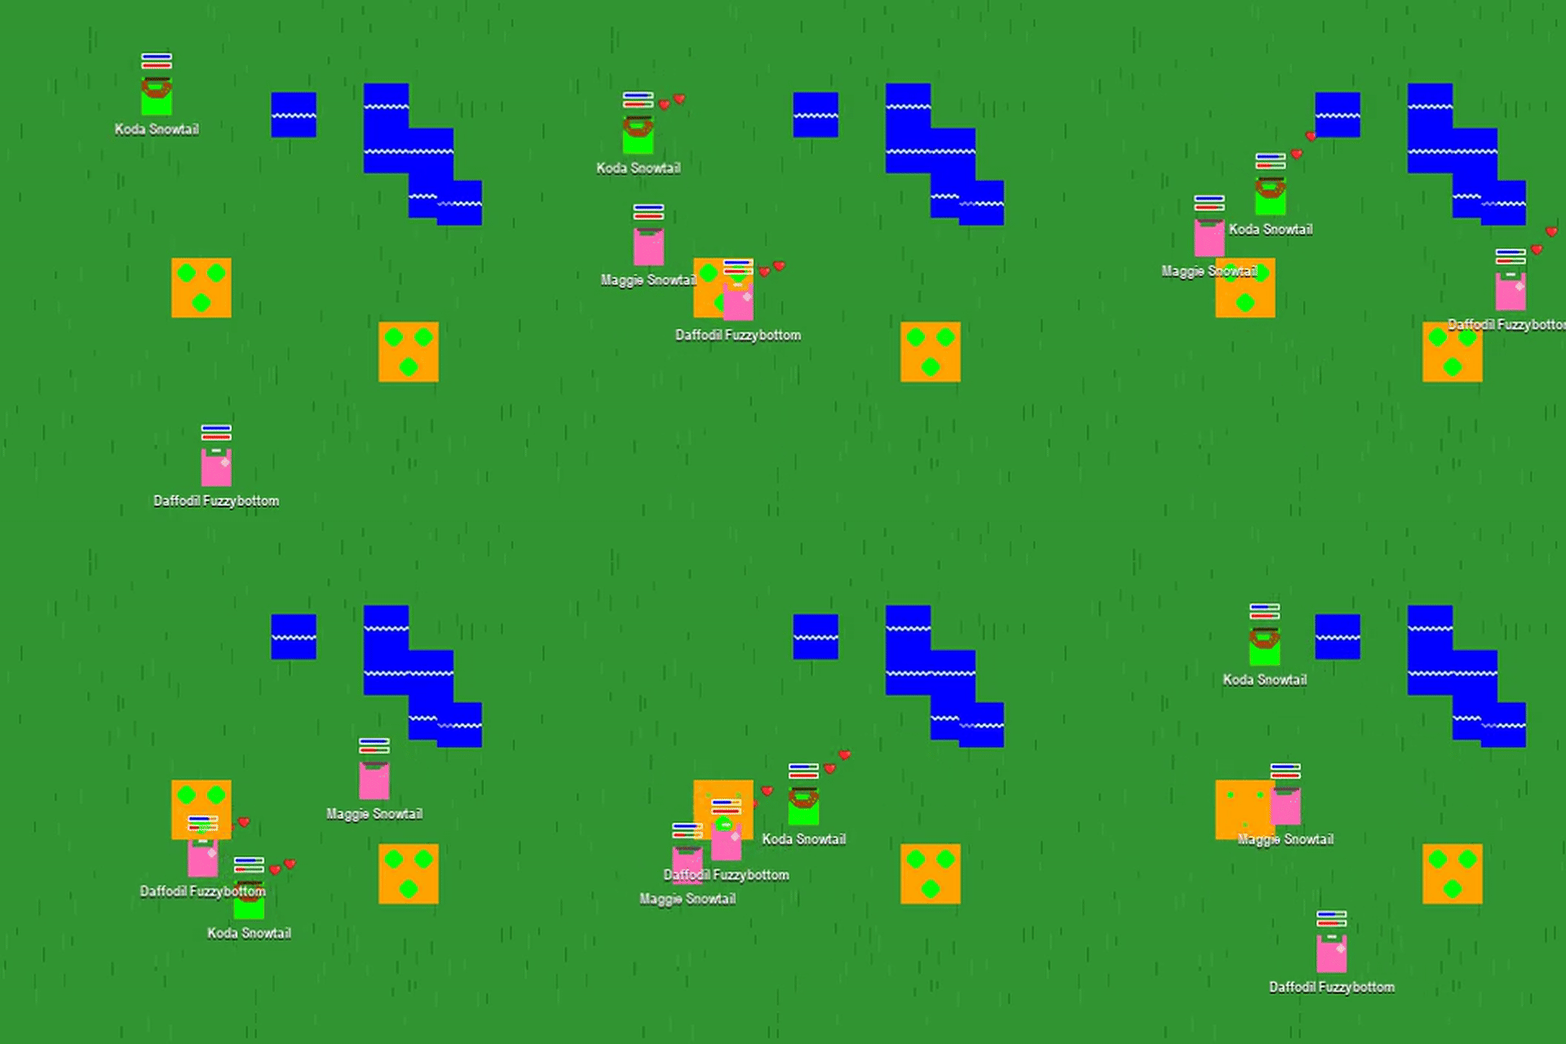
Each character gets a random accessory (like a top hat, sunglasses, or witch hat) for personality and to help track individuals.
Name tags appear above each character, showing their full name.
Characters are color-coded by gender:
Green for males
Pink for females
Overlays & Icons
Hunger and Hydration Bars:
Red and blue bars display each character's current hunger and thirst.
Positioned above their heads for quick readability.
Status Emojis:
💧 Sweat drops: shown when hydration or hunger drops below a threshold.
❤️ Hearts: shown during mating cooldown.
👶 Baby emoji: briefly shown after giving birth.
💤 “Z” particles: shown when characters are resting.
Environment
A procedurally generated grassy background adds texture.
The world includes:
Trees (food sources)
Water pools (hydration)
Rocks (obstacles)
Trees display growing pears, which visually shrink and regrow on cooldown after being eaten.
Trait Evolution Over Time
At the start of the simulations, characters are initialized with the following trait ranges:
Speed: 0.5 to 5.5
Hydration (mating threshold): 70 to 80
Hunger (mating threshold): 70 to 80
These values represent how fast a character moves and how well-nourished or hydrated they must be before being able to reproduce. Over time, these values shift due to natural selection and inherited mutations.
Results.
The data shown below is not from a single simulation run. It is the result of aggregating data from multiple runs of the simulation using different seeds, spawn positions, and random mutations.
Across many runs, a consistent pattern emerges:
Traits like speed tend to increase over generations
Mating thresholds for hunger and hydration tend to decrease
Population growth follows a similar trajectory, with occasional dips due to resource limitations
The graph and sample values presented here reflect an averaged trend — a representative picture of what typically happens in this evolutionary environment.
Average Stats Over Time
time_seconds refers to how much time has passed in the simulation, measured in seconds.
avg_speed is the average movement speed of all living characters at that point in time.
current_hun_mate represents the average hunger level at which characters are willing to reproduce. Higher values mean they wait until they’re more well-fed; lower values mean they’ll mate sooner.
current_hyd_mate is similar, but for hydration. It reflects how thirsty a character can be before it still decides to mate.
total_population is simply the number of characters currently alive in the simulation at that timestamp.
Key Observations from the Simulations
Average speed increased rapidly in the early simulation and stabilized.
At 5 seconds, the average speed was 29.5. By 515 seconds, it had jumped to 50.5 — an increase of over 70%. For the remaining duration (up to 1360 seconds), speed remained stable between 47–51, showing that faster individuals consistently survived and reproduced more.
Hunger mating thresholds steadily dropped by over 30 points.
The average current_hun_mate started at 74.1 (5s) and dropped to 45.9 by 1360s. This indicates an evolutionary trend toward reproducing earlier, even under food stress — a clear advantage in environments where delay could mean death.
Hydration mating thresholds dropped even more sharply.
At the beginning, current_hyd_mate was 74.9. By the end, it had dropped to 40.4 — a drop of over 45%. This shows that characters evolved to prioritize mating before full hydration, likely increasing reproductive opportunities.
Total population quadrupled over the course of the simulation.
The simulation began with 16 characters. By 1360 seconds, the population reached 64 — showing that the combination of increased speed and lower mating thresholds made the population more efficient at surviving and reproducing.
Population dips correspond to rapid trait transitions.
At around 515 seconds, average speed peaked at 50.5, but population briefly dropped to 19. This may reflect a transition phase, where only faster characters survived, but reproduction hadn't yet caught up due to higher energy costs or immature trait balancing.
Traits stabilized after ~900 seconds, showing successful adaptation.
After around 900 seconds, key traits began to level off. Average speed remained between 47 and 51, while hunger and hydration mating thresholds stabilized around the low 40s. The population continued to grow steadily, reaching 64 by the end. This suggests the population had adapted effectively to the environment, with traits optimized for survival and reproduction under the simulation’s constraints.
Evolution in Action — Validating Darwin’s Theories
Natural Selection
The simulation shows that traits which improve survival and reproduction (like higher speed or lower mating thresholds) become more common in the population. Characters that move faster or reproduce earlier consistently outcompete others — exactly as natural selection predicts.
— Darwin’s theory:
Individuals with advantageous traits are more likely to survive and reproduce, passing those traits on to the next generation.
Differential Reproductive Success
Not all characters reproduce equally. Some die early due to low speed or inefficient behaviour, while others produce many offspring and create dominant family lines. This reflects differential fitness — where reproductive success, not just survival, drives evolution.
— Darwin’s theory:
It's not enough to survive — the traits that lead to more offspring are the ones that persist.
Descent with Modification
Offspring in the simulations inherit traits from their parents, with slight mutations. Over time, these small changes accumulate, leading to measurable shifts in the population’s average traits — such as increased speed and lower mating thresholds.
— Darwin’s theory:
Species evolve through gradual changes in inherited traits over many generations.
Adaptation
Over time, the population becomes better suited to its environment. Mating happens sooner, characters survive longer, and the population stabilizes around trait values that work well. This is adaptation in real time — driven by selection pressure.
— Darwin’s theory:
Populations change over time to become more suited to their environments through natural selection.
Conclusion & Next Steps
What's Next?
This project began as a simple curiosity — could I simulate Darwinian evolution in a visual, self-contained system? What emerged was a surprisingly complex and consistent pattern of change driven by nothing more than resource limits, inherited traits, and survival pressure.
Over multiple runs, the simulation reliably demonstrated key principles of evolution: natural selection, heredity with variation, differential reproduction, and long-term adaptation. Even with randomness introduced through mutation and movement, the system found its way toward efficiency — faster movement, lower mating thresholds, and increasing population fitness.
But not every run was successful. In some cases, one gender died out entirely by chance — ending reproduction altogether. These outcomes highlight the role of random genetic drift and how evolution is not guaranteed to work smoothly in small populations. Sometimes, chance alone can shape the outcome more than fitness.
In future versions, I plan to:
Introduce predators to simulate more complex food chains
Add seasonal environments with changing resource availability
Track lineage trees and visualize genetic drift over time
Implement genetic recombination and dominant/recessive traits
Each of these features will build on the same foundation — letting simple rules reveal complex, emergent behaviour.


